comments,
ephemera, speculation, etc.
(protected political
speech and personal opinion)
2023- 2023-08-21 e THE STATE OF
THE DISUNION XI
HERE IS ONE REASON WHY I
LIVE IN A PLACE WHERE
THERE WAS JUST ONE BLACK IN MY HIGH SCHOOL CLASS
OF MORE THAN 700 AND I CAN GO 2 TO 3 WEEKS
WITHOUT SEEING A BLACK
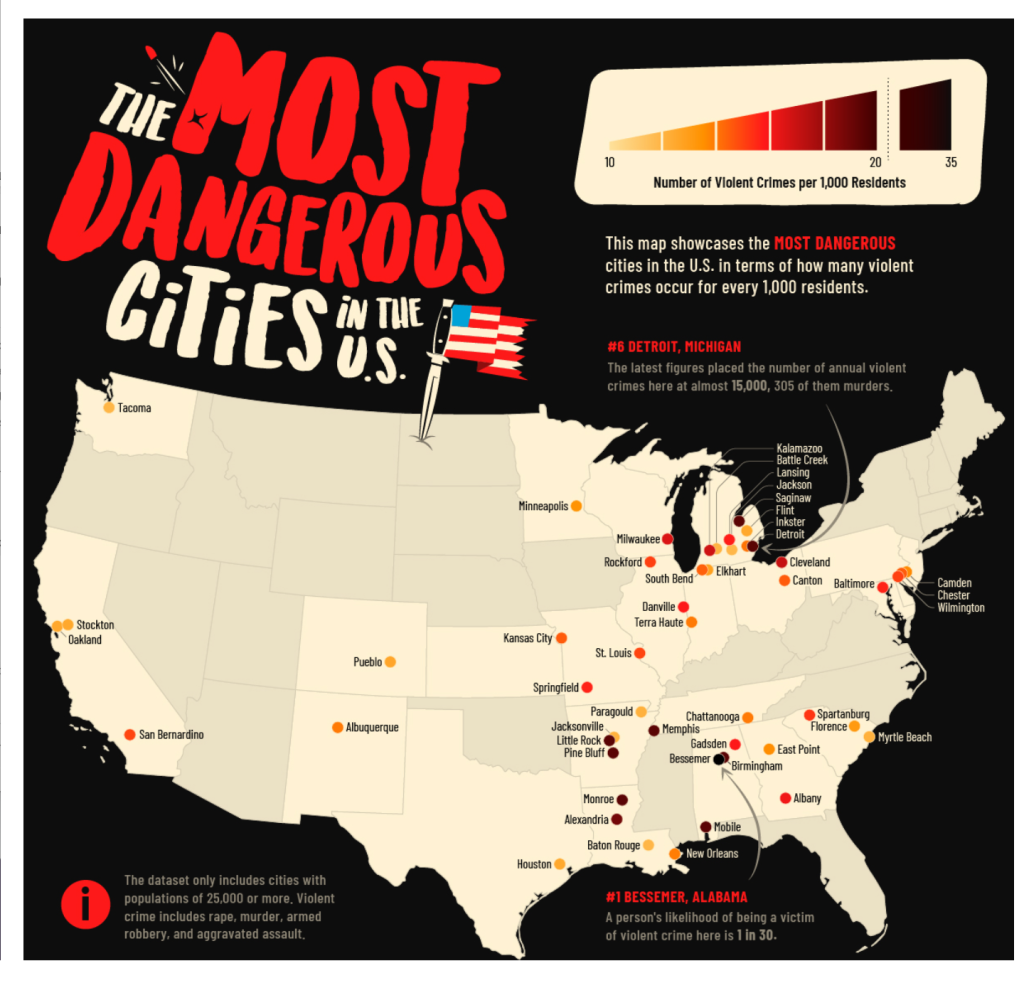
Here Are the Most Dangerous
Cities in the US
NeighborhoodScout
does an annual report on the most dangerous cities
US per capita. Let’s see what cities are on the list
for 2023.
Data from the NeighborhoodScout, image
from the Visual Capitalist
Our research
reveals the 100 most dangerous cities in America
with 25,000 or more people, based on the number of
violent crimes per 1,000 residents. Violent
crimes include rape, armed robbery, and aggravated
assault. The data used for this research are
the number of violent crimes reported to have
occurred in each city, and the population of each
city. Based on the latest national data
available at the time of publication, representing
calendar year 2021 and released in October 2022,
this report reveals interesting patterns about
safety from crime in America.
This year,
Monroe, LA was replaced by Bessemer, AL, dropping
from its two-year ranking as the number one most
violent city in America to the ranking of
third. Bessemer has 33.18 violent crimes per
1,000 population, and the chance of being a
violent crime victim is 1 in 30.
Many of the
dangerous cities on the list this year have
appeared on past lists. For those who live
in these cities, NeighborhoodScout can help you
find the safest neighborhoods nearby any city
using our Create feature.
For example, by searching for the lowest crime
rate within 15 miles of the number
one most dangerous city, Bessemer, AL you can find
the neighborhood of New Hope in Birmingham,
AL is safer than 99% of neighborhoods
nationwide.
Top 22
Bessemer, AL Violent
Crime Rate (per 1,000 residents): 33.1 Your chance
of being a victim: 1 in 30
Mobile, AL Violent
Crime Rate (per 1,000 residents): 27.9 Chance of
being a victim: 1 in 35
Monroe, LA Violent
Crime Rate (per 1,000 residents): 26.3 Chance of
being a victim: 1 in 38
Saginaw, MI Violent
Crime Rate (per 1,000 residents): 25.1 Chance of
being a victim: 1 in 39
Memphis, TN Violent
Crime Rate (per 1,000 residents): 25.1 Chance of
being a victim: 1 in 39
Detroit, MI Violent
Crime Rate (per 1,000 residents): 23.0 Chance of
being a victim: 1 in 43
Birmingham, AL Violent
Crime Rate (per 1,000 residents): 20.6 Chance of
being a victim: 1 in 49
Pine Bluff, AR Violent
Crime Rate (per 1,000 residents): 20.5 Chance of
being a victim: 1 in 48
Little Rock, AR Violent
Crime Rate (per 1,000 residents): 20.2 Chance of
being a victim: 1 in 49
Alexandria, LA Violent
Crime Rate (per 1,000 residents): 18.8 Chance of
being a victim: 1 in 53
Cleveland, OH Violent
Crime Rate (per 1,000 residents): 17.1 Chance of
being a victim: 1 in 58
Kalamazoo, MI Violent
Crime Rate (per 1,000 residents): 16.8 Chance of
being a victim: 1 in 59
Milwaukee, WI Violent
Crime Rate (per 1,000 residents): 16.6 Chance of
being a victim: 1 in 59
Albany, GA Violent
Crime Rate (per 1,000 residents): 16.1 Chance of
being a victim: 1 in 61
Gadsden, AL Violent
Crime Rate (per 1,000 residents): 15.8 Chance of
being a victim: 1 in 63
Danville, IL Violent
Crime Rate (per 1,000 residents): 15.8 Chance of
being a victim: 1 in 63
Lansing, MI Violent
Crime Rate (per 1,000 residents): 15.7 Chance of
being a victim: 1 in 63
Baltimore, MD Violent
Crime Rate (per 1,000 residents): 15.6 Chance of
being a victim: 1 in 63
Springfield, MO Violent
Crime Rate (per 1,000 residents): 15.6 Chance of
being a victim: 1 in 64
Spartanburg, SC Violent
Crime Rate (per 1,000 residents): 15.2 Chance of
being a victim: 1 in 65
Rockford, IL Violent
Crime Rate (per 1,000 residents): 15.0 Chance of
being a victim: 1 in 66
Wilmington, DE Violent
Crime Rate (per 1,000 residents): 15.0 Chance of
being a victim: 1 in 66
Most Dangerous
Cities in America
(with racial composition).
Cities with the
highest violent crime rates:
1) Bessemer, AL: Black or African
American: 72.53% White: 20.34% Other
race: 3.74%
2) Mobile, AL: Black or African
American: 52.53% White: 41.46%
3) Monroe, LA: Black or African
American: 59.7% White: 35.88%
4) Saginaw,MI: Black 44.2%
White 35.9% Hispanic 15.7%.
5) Memphis, TN: Black or African
American (Non-Hispanic) 64.2%, White
(Non-Hispanic) 24.9%, Other Hispanic) 3.14%, White
(Hispanic) 3.01%,
6) Detroit, MI: Black77.5% White
10.1% Hispanic 7.8%.
Cities with the
lowest violent crime rates (with racial
composition).
1) Ridgefield, CT: 96.12% White,
0.62% Black or African American, 0.09% Native
American, 2.08% Asian, 0.03% Pacific Islander,
0.36% from other races,
2) Franklin, MA: White (Non-Hispanic)
87.6%, Asian (Non-Hispanic) 5.92%, Two+
(Non-Hispanic) 2.29%, White (Hispanic) 1.92%, and
Black or African American (Non-Hispanic) 1.41%.
3) Lake in the Hills,
Il: White:
83.47% Asian: 6.23% Two or more races:
6.04%
4) Marshfield, MA: White (Non-Hispanic)
94.6%, White (Hispanic) 3.97%, Two+
(Hispanic) 0.732%, Asian (Non-Hispanic) 0.482%,
and Two+ (Non-Hispanic) 0.173%
5) Arlington, MA: White 83.6%,
2.3% African American, 0.1% Native American, 8.3%
Asian, 0.4% from other races, and 2.1% from two or
more races.
6) Fulshear, TX: White: 66.81%
Asian: 13.36% Two or more races: 11.9% Other race:
4.54% Black or African American: 2.69% Native
American: 0.7% Native Hawaiian or Pacific
Islander: 0%
______________________
Permission is hereby granted to any and all to
copy and paste any entry on this page and
convey it electronically along with its URL, ______________________
...
News and facts for
those sick and tired of the National Propaganda Radio
version of reality.
- Unlike all the legacy media, our editorial offices are
not in Langley, Virginia.
- You won't catch
us fiddling while Western Civilization burns.
- Close the windows so you don't hear the
mockingbird outside, grab a beer, and see what the hell
is going on as we witness the controlled demolition of
our society.
- The truth
usually comes from one source. It comes quietly, with no
heralds. Untruths come from multiple sources, in unison,
and incessantly.
- The loudest
partisans belong to the smallest parties. The media
exaggerate their size and influence.
If
you let them redefine words, they will control
language.
If you let them control language, they will
control thoughts.
If you let them control thoughts, they will
control you. They will own you.


Most Dangerous Cities in America
(with racial composition).
Cities with the highest violent crime rates:
1) Bessemer, AL: Black or African American: 72.53% White: 20.34% Other race: 3.74%
2) Mobile, AL: Black or African American: 52.53% White: 41.46%
3) Monroe, LA: Black or African American: 59.7% White: 35.88%
4) Saginaw,MI: Black 44.2% White 35.9% Hispanic 15.7%.
5) Memphis, TN: Black or African American (Non-Hispanic) 64.2%, White (Non-Hispanic) 24.9%, Other Hispanic) 3.14%, White (Hispanic) 3.01%,
6) Detroit, MI: Black 77.5% White 10.1% Hispanic 7.8%.
Cities with the lowest violent crime rates
(with racial composition).
1) Ridgefield, CT: 96.12% White, 0.62% Black or African American, 0.09% Native American, 2.08% Asian, 0.03% Pacific Islander, 0.36% from other races,
2) Franklin, MA: White (Non-Hispanic) 87.6%, Asian (Non-Hispanic) 5.92%, Two+ (Non-Hispanic) 2.29%, White (Hispanic) 1.92%, and Black or African American (Non-Hispanic) 1.41%.
3) Lake in the Hills, Il: White: 83.47% Asian: 6.23% Two or more races: 6.04%
4) Marshfield, MA: White (Non-Hispanic) 94.6%, White (Hispanic) 3.97%, Two+ (Hispanic) 0.732%, Asian (Non-Hispanic) 0.482%, and Two+ (Non-Hispanic) 0.173%
5) Arlington, MA: White 83.6%, 2.3% African American, 0.1% Native American, 8.3% Asian, 0.4% from other races, and 2.1% from two or more races.
6) Fulshear, TX: White: 66.81% Asian: 13.36% Two or more races: 11.9% Other race: 4.54% Black or African American: 2.69% Native American: 0.7% Native Hawaiian or Pacific Islander: 0%